Allison Bailey
Web Mapping Portfolio for University of Kentucky New Maps Plus
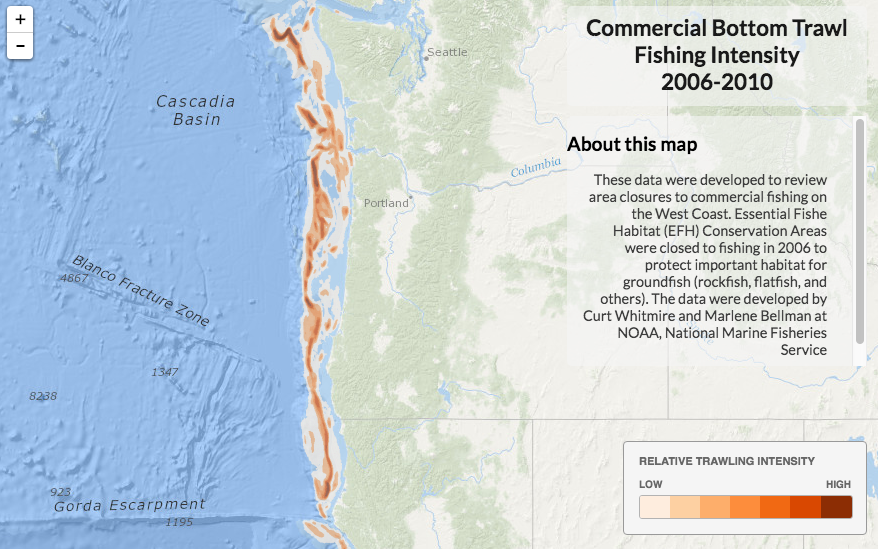
This map was developed with Leaflet using data hosted on CartoDB and customized with CartoDB.js.
It demonstrates that with only a few lines of code, one can easily create a web map using data that is hosted on CartoDB and customize the symbology using CartoDB.js. CartoDB provides the the power of PostGIS and SQL queries for web mapping.
The source data were developed by Curt Whitmire and Marlene Bellman of NOAA, National Marine Fisheries Service and provided through the Essential Fish Habitat Catalog
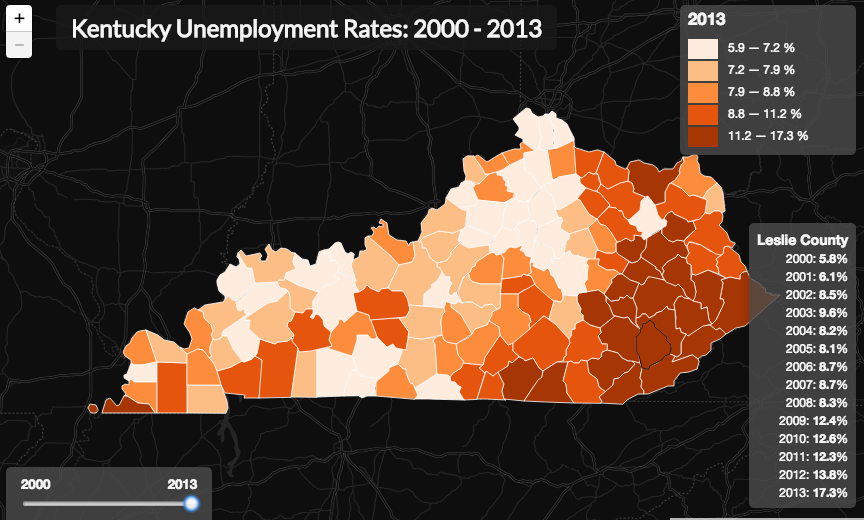
This map was developed with the Leaflet, PapaParse, and Simple Statistics javascript libraries.
This project exposed us to a large variety of techniques that can be applied to most web mapping projects. These techniques included: loading data asynchronously via AJAX, joining spatial GeoJSON data to an associated csv data file, drawing a choropleth map that is symbolized dynamically from the data values, providing visual affordances and interactivity with the data, and creating a time slider
The source data were provided by Rich Donohue for the Maps 673 course.
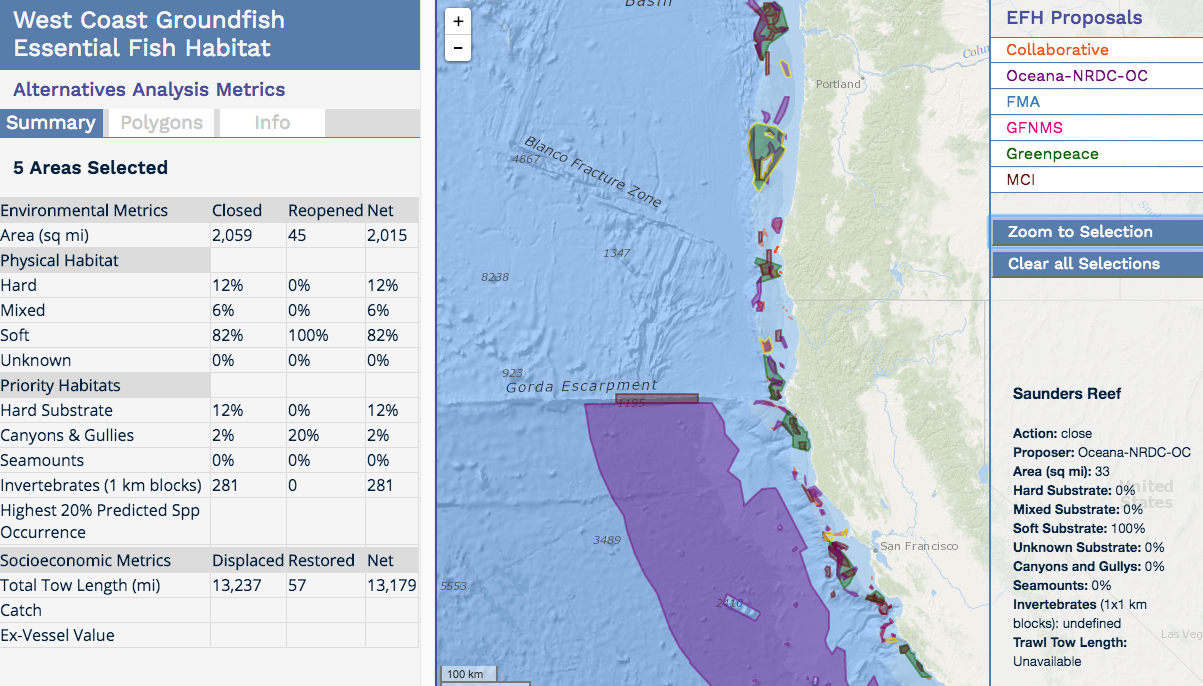
This mapping application was developed with the Leaflet, JQuery, and Turf javascript libraries.
This project was the culmination of the course and required all the JavaScript programming and HTML/CSS design skills we had developed, as well as many new ones. My project required a higher level of user interactivity and more UI and design components than we had previously encountered in the coursework. Needless to say, it was a challenge to put all the pieces together and present them in an understandable and useful way for the intended users.
For more information and background on the application, launch the EFH Metrics application and click on the Info tab.